Grafana is an open-source web application specialized in time-series visualization. Hence, it is suitable for the the purpose of monitoring. One of interesting facts is that Grafana is a fork from Kibana 3 to enhance the ability of dashboard editing and make it as a clean and elegant time-series visualization tool. To get the sense of Grafana dashboard, surf this link: https://play.grafana.org.
If you are looking for kind of visualization tool in business intelligent category, please consider other ones like Superset, Redash, etc.
Installation
CentOS 7 is a selected as demonstration, should be similar to other Linux distro.
1. Download and install, find the latest version from here.
1 | wget https://dl.grafana.com/oss/release/grafana-6.5.2-1.x86_64.rpm |
2. Start the server
1 | sudo systemctl daemon-reload |
3. Enable Grafana to start at boot
1 | sudo systemctl enable grafana-server.service |
You should be able to access Grafana UI after step#3, further configurations can be referred in step#4 & step#5 to make it ready for production.
4. Update /etc/grafana/grafana.ini file
Server
1
2domain = vanducng.dev
root_url = https://grafana.vanducng.devSMTP/Email
1
2
3
4
5
6
7
8
9
10
11
12
13
14
15
16
17#################################### SMTP / Emailing ##########################
[smtp]
enabled = true
host = mail.vanducng.dev:587
user = [email protected]
# If the password contains # or ; you have to wrap it with triple quotes. Ex """#password;"""
password = xxxx
#cert_file =
#key_file =
skip_verify = true
from_address = [email protected]
from_name = Grafana Alert
# EHLO identity in SMTP dialog (defaults to instance_name)
;ehlo_identity = dashboard.example.com
[emails]
welcome_email_on_sign_up = trueExternal storage
1
2
3
4
5
6
7
8
9
10
11
12#################################### External image storage ##########################
[external_image_storage]
# Used for uploading images to public servers so they can be included in slack/email messages.
# you can choose between (s3, webdav, gcs, azure_blob, local)
provider = s3
[external_image_storage.s3]
bucket = vanducng-services
region = ap-southeast-1
path = s3://vanducng-services/grafana-images
access_key = xxxxx
secret_key = xxxxx
5. Update /etc/grafana/ldap.toml
Grafana supports LDAP integration simply by editing this config file.
1 | bind_dn = "cn=admin,dc=vanducng,dc=dev" |
Setting Alert
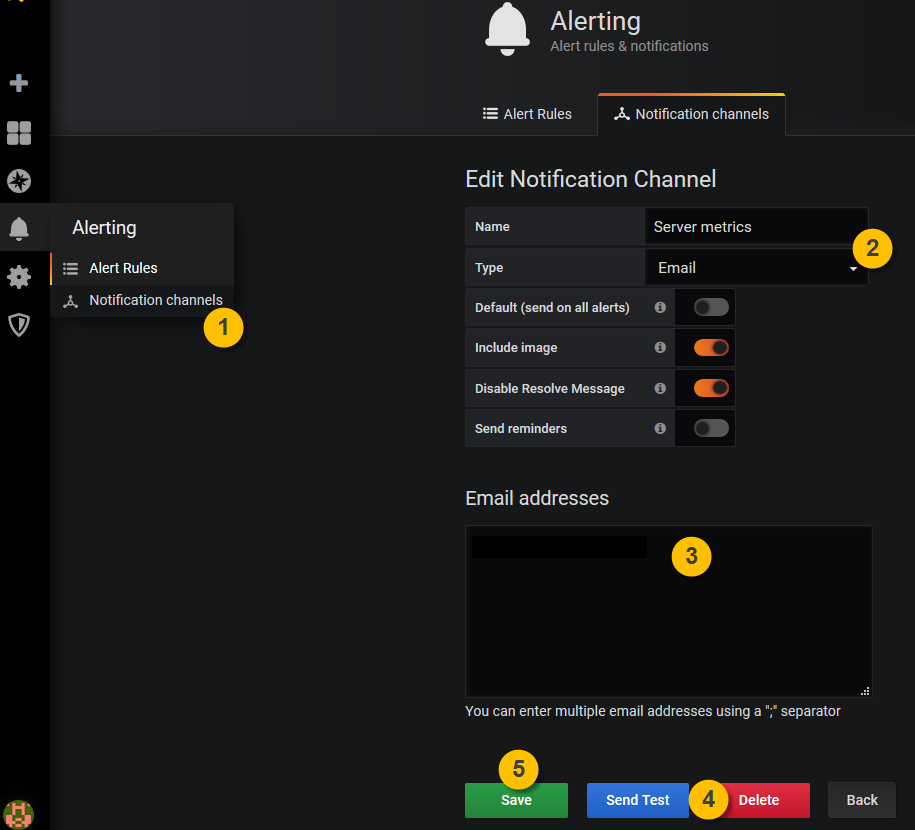
One of great feature on Grafana is ability to set alert to send email or notification.
Setup email channel as following, then limit trigger from particular metric on a dashboard will be sent to list of email.
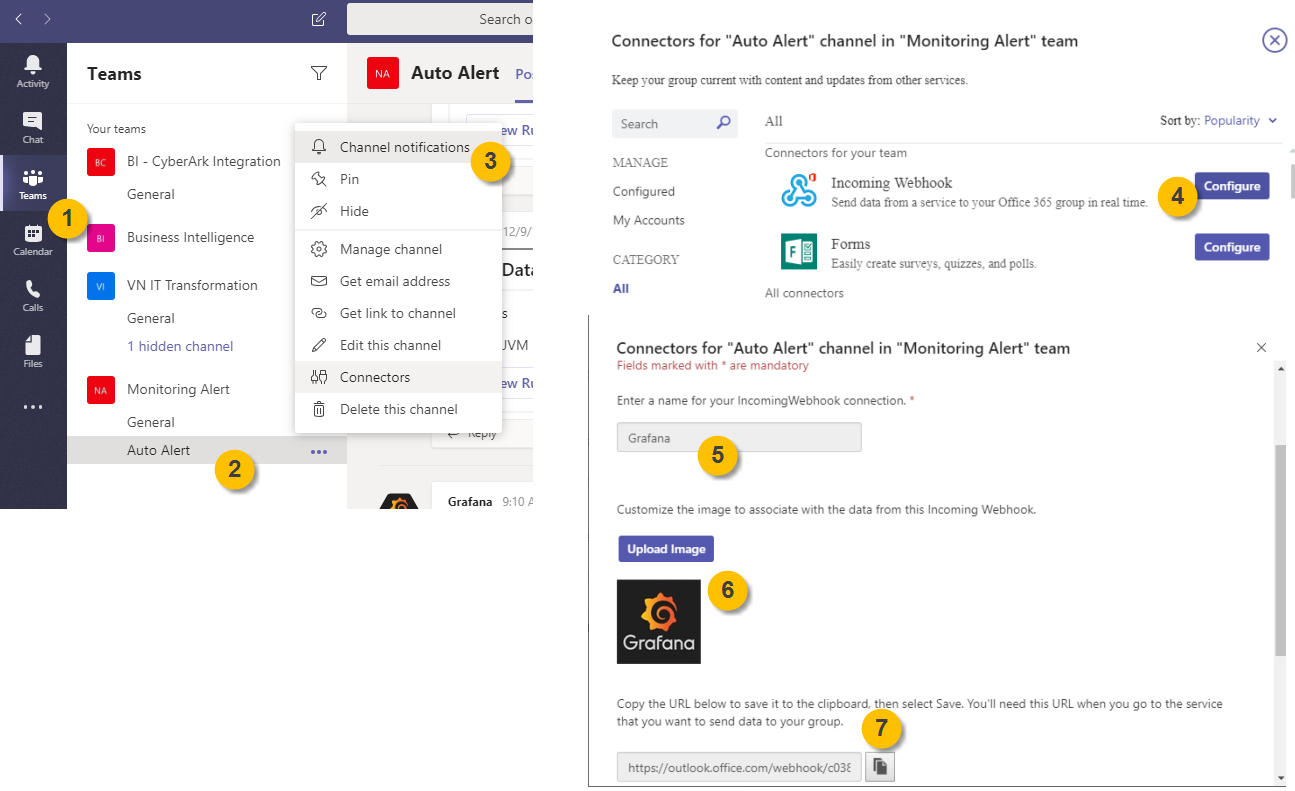
- Push Notification
MSTeam is used for this demonstrattion, from your created group in MSTeam, follow below step to generate Webhook URL.
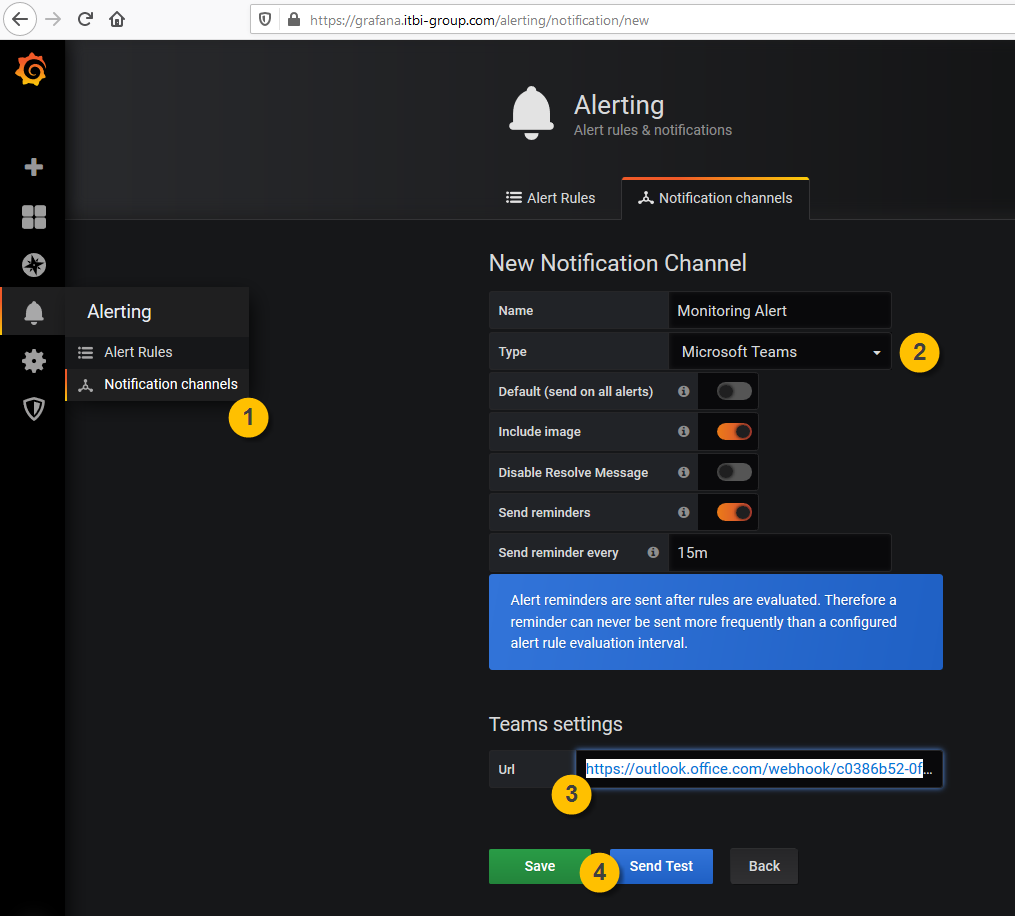
From Grafana, paste the Webhook URL from previous step with bellow settings:
Comments