When do researching to choose a good data storage technique for log collection, searching and analytic; I found elasticsearch is a ideal choice because of following reasons:
- Performance: fast query with million records within miliseconds, it is thanks to indexing document technique with Lucene engine running under-the-hood.
- Scalability: elasticsearch can be expanded by simply configuring new nodes when resource increase needed.
- Integration : it is compatible with elastic stacks (beats: metric, file, heart, etc. ) and others (Fluentd, grafana, etc.) which support many purposes to monitor multiple system and services.
Installation
In the meanwhile, the latest ElasticSearch is in version 7.x with numerous breaking change and not 100% nicely work with our current services, then ES 6.8.5 is selected. The installation is documented in detailed from Official Website. Since our server is running CentOS 7, the RPM installation method is used.
1 | yum install -y java-1.8.0-openjdk-devel |
Following the recommend steps to get the ES started or stopped.
1 | sudo chkconfig --add elasticsearch |
Configuration
System scope
This is where you can configure location of elasticsearch or java installation, keep it as default. In version 7.x, saperation installation of Java is not required.
1 | nano /etc/sysconfig/elasticsearch |
Application scope
elasticsearch.yml
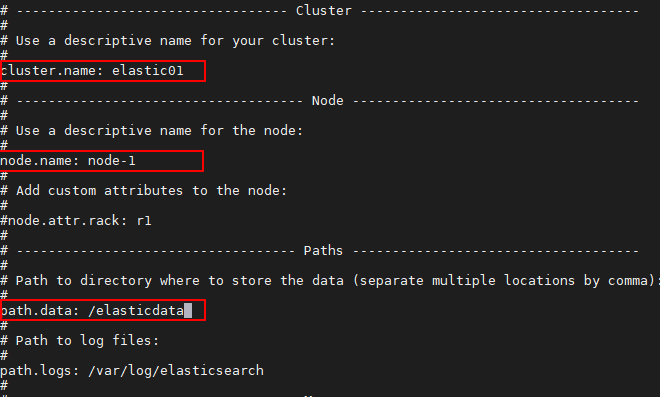
Within elasticsearch.yml file, generic information for targeted cluster, node, data storage path, etc. can be customized and override the default settings. In this example, i did change the cluster, node name and elastic data location.
1 | nano etc/elasticsearch/elasticsearch.yml |
jvm.options
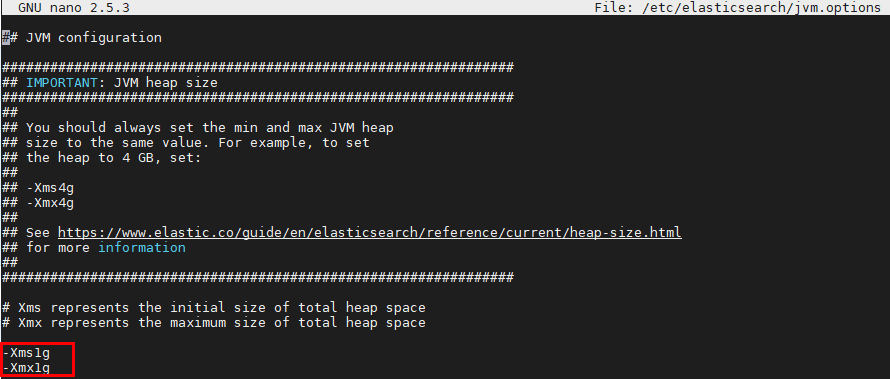
This is where the JVM resource configuration dedicated for your elasticsearch application. Initial and maximum heap are what should be noticed.
Best practice is to allocate haft of your available system memory to achieve the optimal performance with Elasticsearch. Our CentOS has 3GB RAM free when running along with other applications, then the heap size is recommended with 1.5GB. However, for experiment purpose with few small logs, I reserved only 1GB as below. Check your RAM available with command free -m
1 | nano /etc/elasticsearch/jvm.options |
Change elastic data location
In some cases, there is a need of store elastic data in separate drive for better management, below steps will help. For instance, I want to store data in /elasticdata/.
1 | mkdir /elasticdata/ |
Check user/group running elasticsearch application:
1 | cat /etc/passwd |
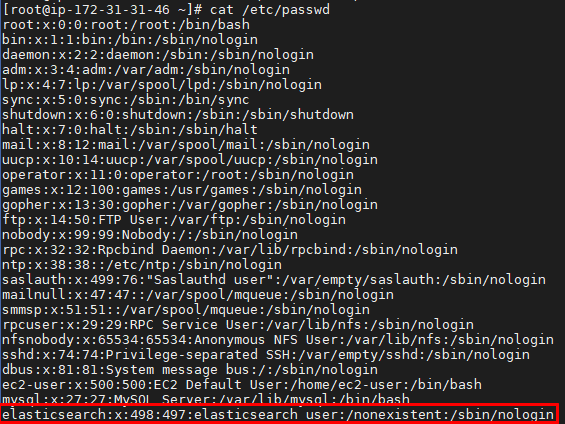
Change owner of elasticdata location to elasticsearch application user
1 | chown elasticsearch.elasticsearch /elasticdata/ |
Restart elasticsearch service, you can check the RAM status and running services after that.
1 | service elasticsearch restart |
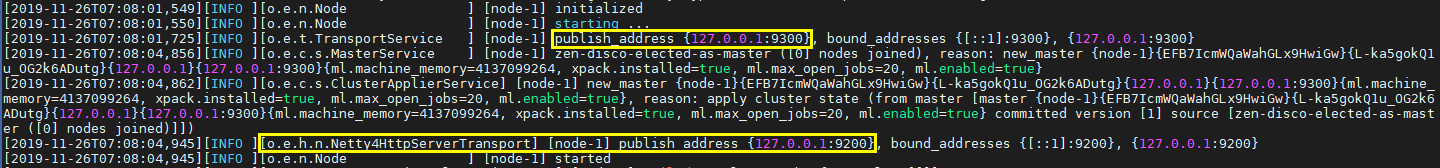
Log exploration
The log will be generated in /var/log/elasticsearch/
1 | ls -latr /var/log/elasticsearch/ |
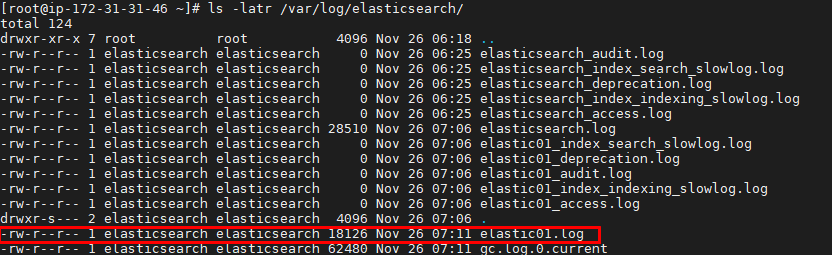
Explore the log:
1 | cat tail /var/log/elasticsearch/elastic01.log |
Quick tour with Elasticsearch
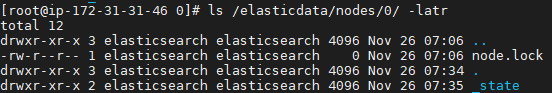
Physical data
You can check the data in our node which is currently node 0. It is mostly nothing as there are no indices avaliable.
1 | ls /elasticdata/nodes/0/ |
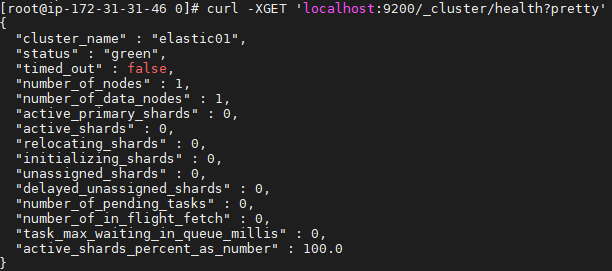
Curl command
Now you can verify if the ElasticSearch is working by simple queries as below to check the cluster health and statistic:
1 | curl -XGET 'localhost:9200/_cluster/health?pretty' |
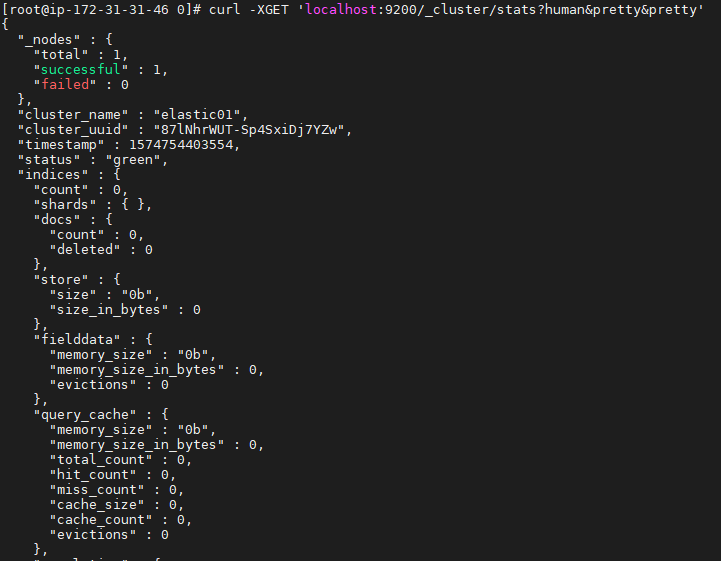
1 | curl -XGET 'localhost:9200/_cluster/stats?human&pretty&pretty' |
Python ingestion with requests library
At first, you can dump some faking data with simple python2 script as below.
1 | from datetime import timedelta, date, datetime |
Python API
Once get familiar, take the advantage of available python api client (see below link) to make your job done in a timely manner.
https://elasticsearch-py.readthedocs.io/en/master/
Comments