
Kibana is part of ELK stack to visualize data from elasticsearch. Further than that, Kibana is equipped with many features and plug-ins such as elastic nodes & infrastructure monitoring, user roles or life cycle management and query experiment elasticsearch database.
Spend sometime with the demo Kibana page to feel it. Click Here.
Getting started
Basic setup
The following steps are applicable for CentOS 7 which is supposed to be similar to other Linux distro.
Follow the direction from official guide to install Kibana.
1 | rpm --import https://artifacts.elastic.co/GPG-KEY-elasticsearch |
Start or stop Kibana service by following commands:
1 | systemctl start kibana |
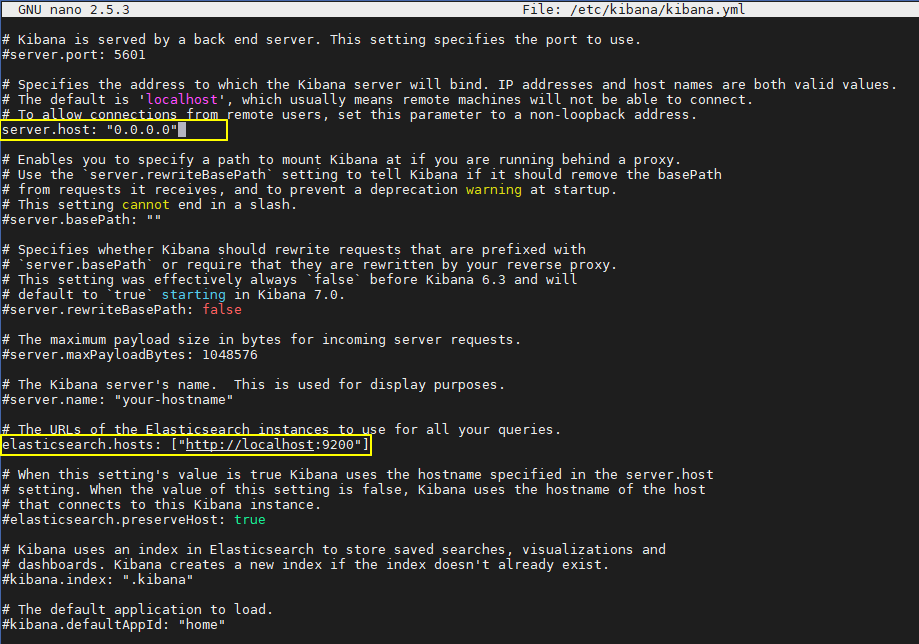
Similarly to ElasticSearch, Kibana configuration file can be modified from /etc/kibana/kibana.yml. The default port is 5601, the elastic host is installed in same server at port 9200, then uncomment it as localhost:9200. At server.host, make it as ‘0.0.0.0’ so Kibana can listen on any IP address instead of localhost.
1 | nano /etc/kibana/kibana.yml |
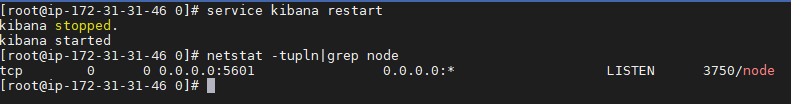
Restart the Kibaba service to get the setting updated
1 | service kibana restart |
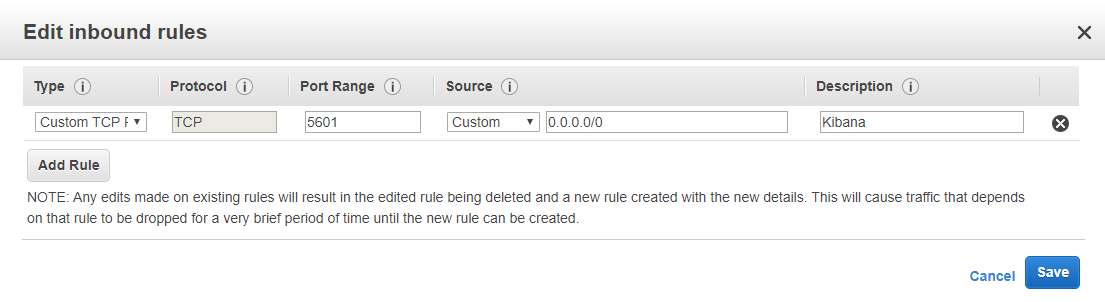
Configure the Inbound port so the Kibana can be accessed from external
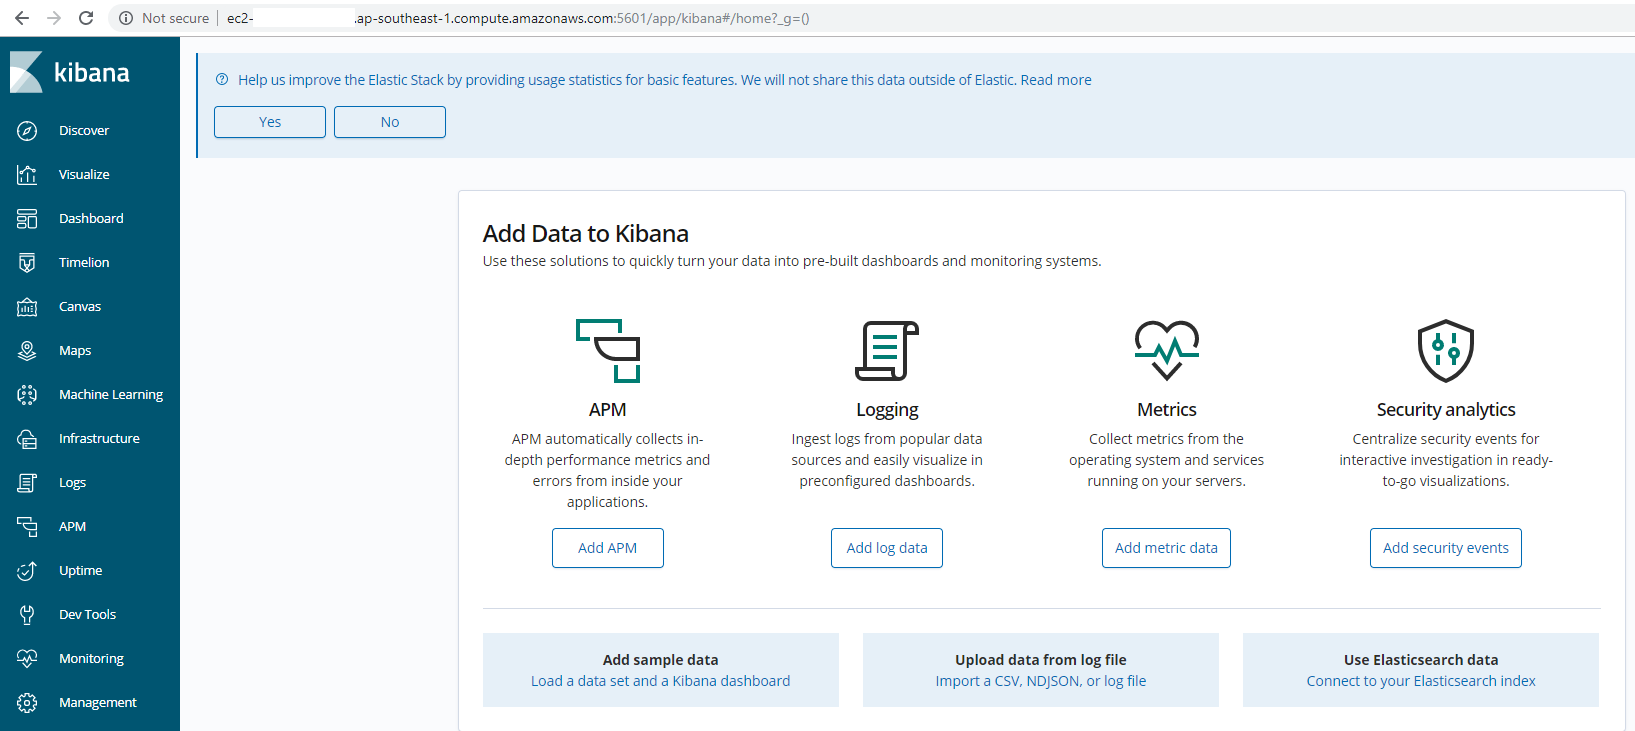
Now you can start working on Kibana
Security setup
The official setup can be referred from here.
Run below command and manually input passwords for each service in ELK stack (including Elastic and Kibana). As noted from the instruction, this command can be used only at the first time setup, afterward the password management can be updated from Kibana UI.
1 | cd /usr/share/elasticsearch/bin/ |
One more steps to re-edit the kibana.yml file
1 | # If your Elasticsearch is protected with basic authentication, these settings provide |
The password setup tool is located in elasticsearch binary folder, so this path can be different on variant versions and OS. There is a useful tutorial on how to handle this task from Youtube.
Quick tour with Kibana
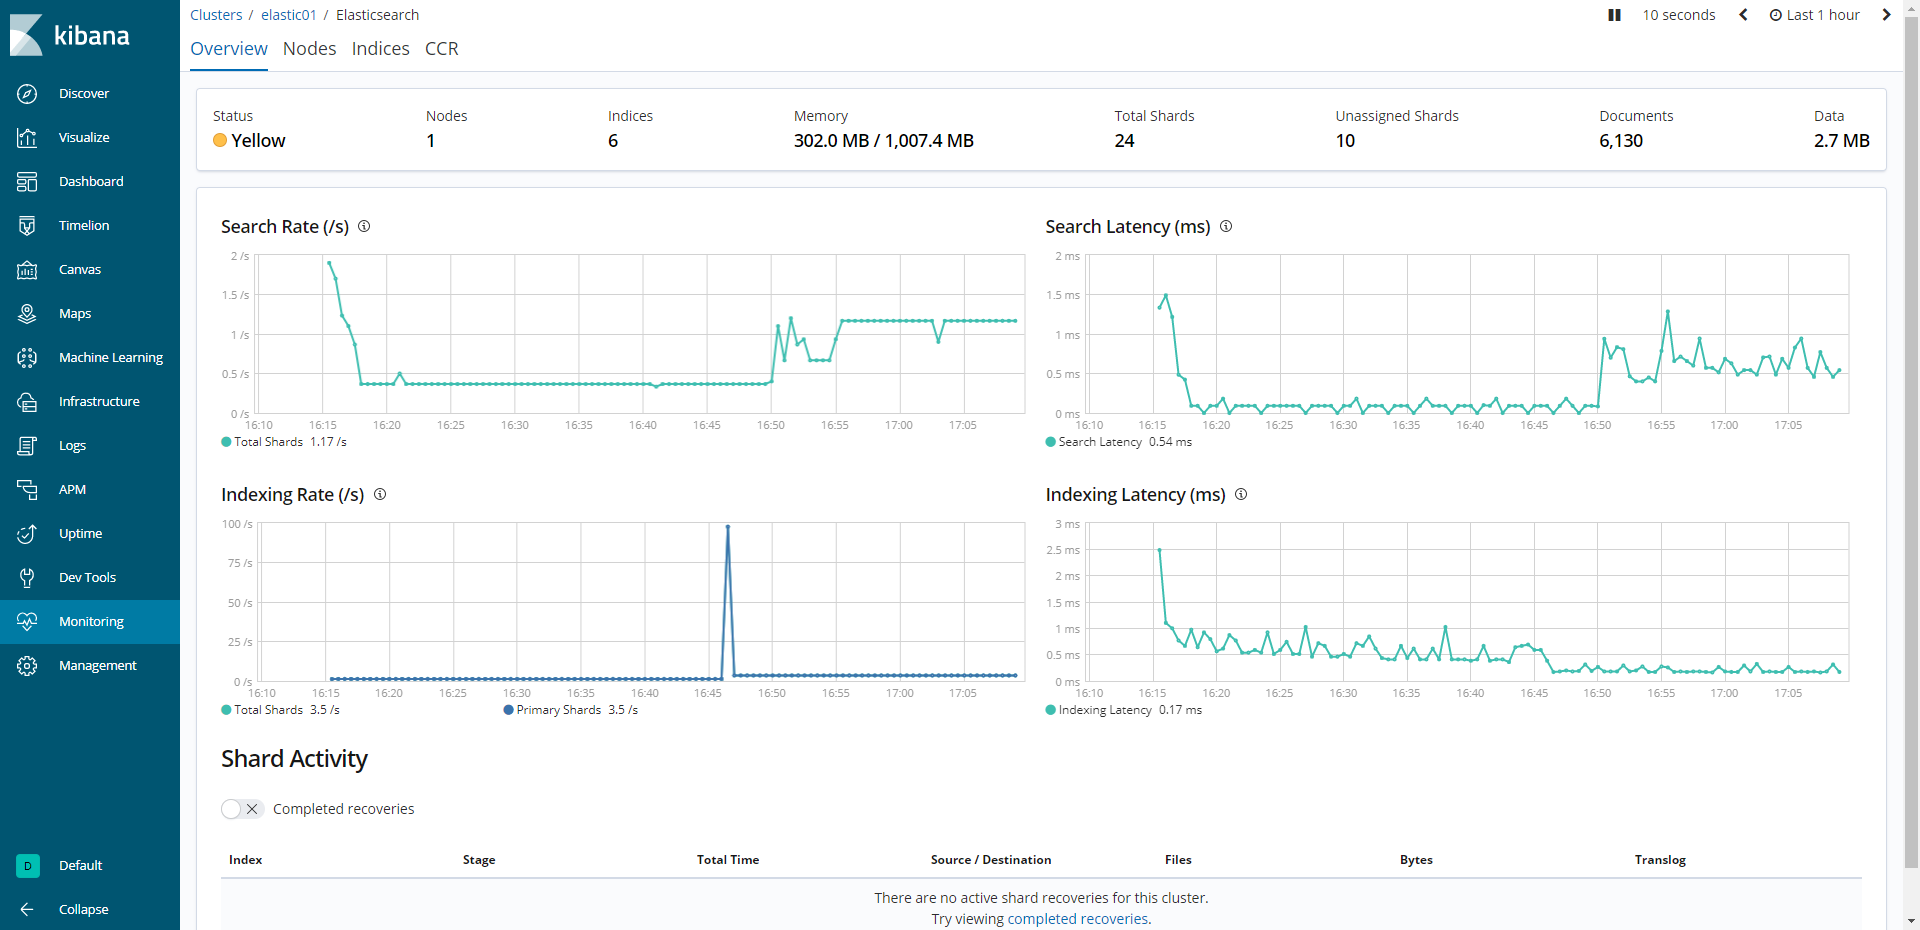
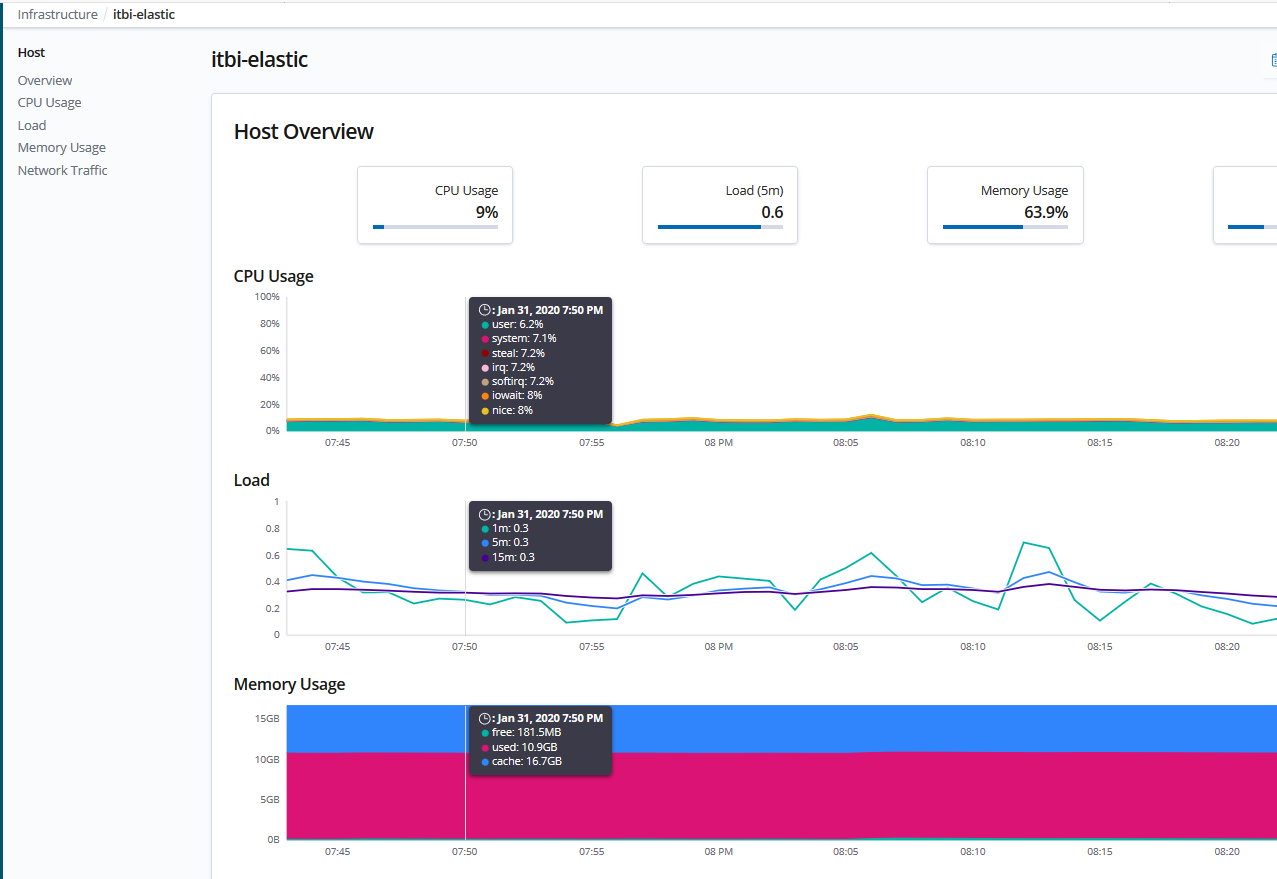
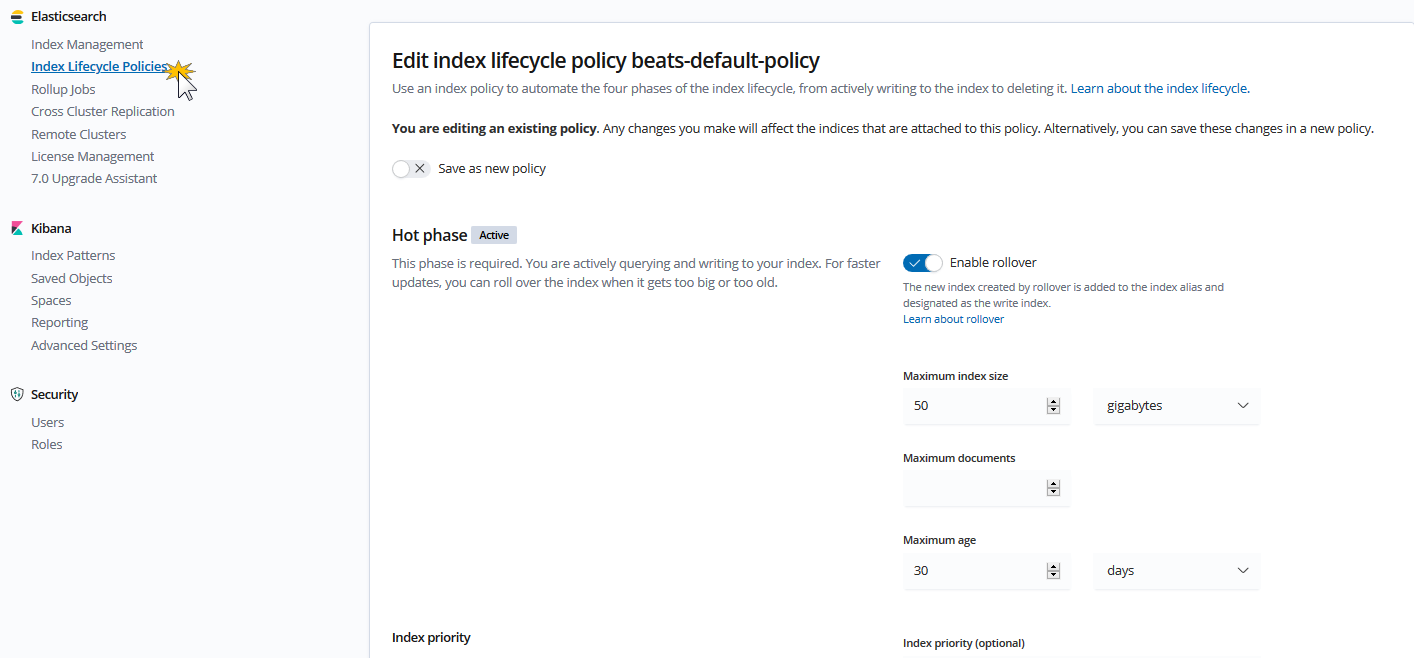
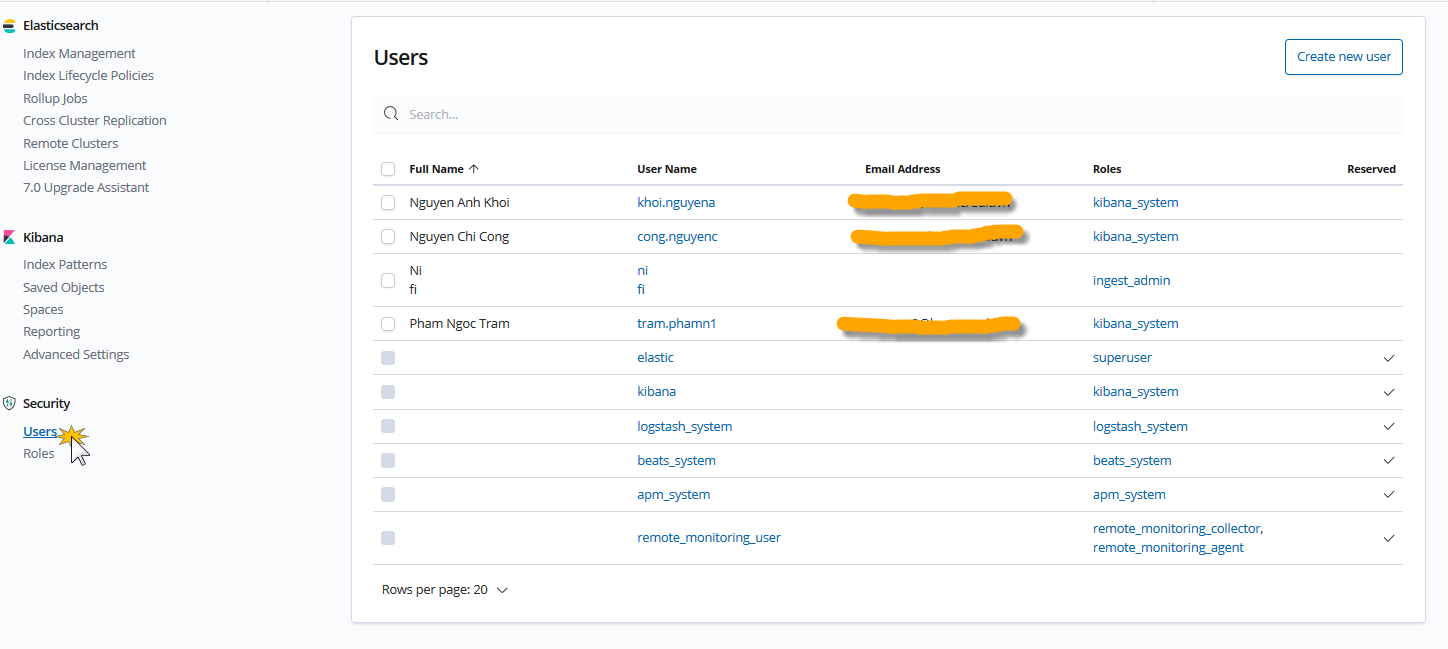
As stated above, Kibana is a powerful tool to play as a central management for Elastic Stack. Below demonstrates its abilities in monitoring cluster, infrastructure via Metricbeats or managing the users, index life cycle.
- Monitor cluster
- Monitor infrastructure
- Manage lifecycle
- Manage user roles
Comments