
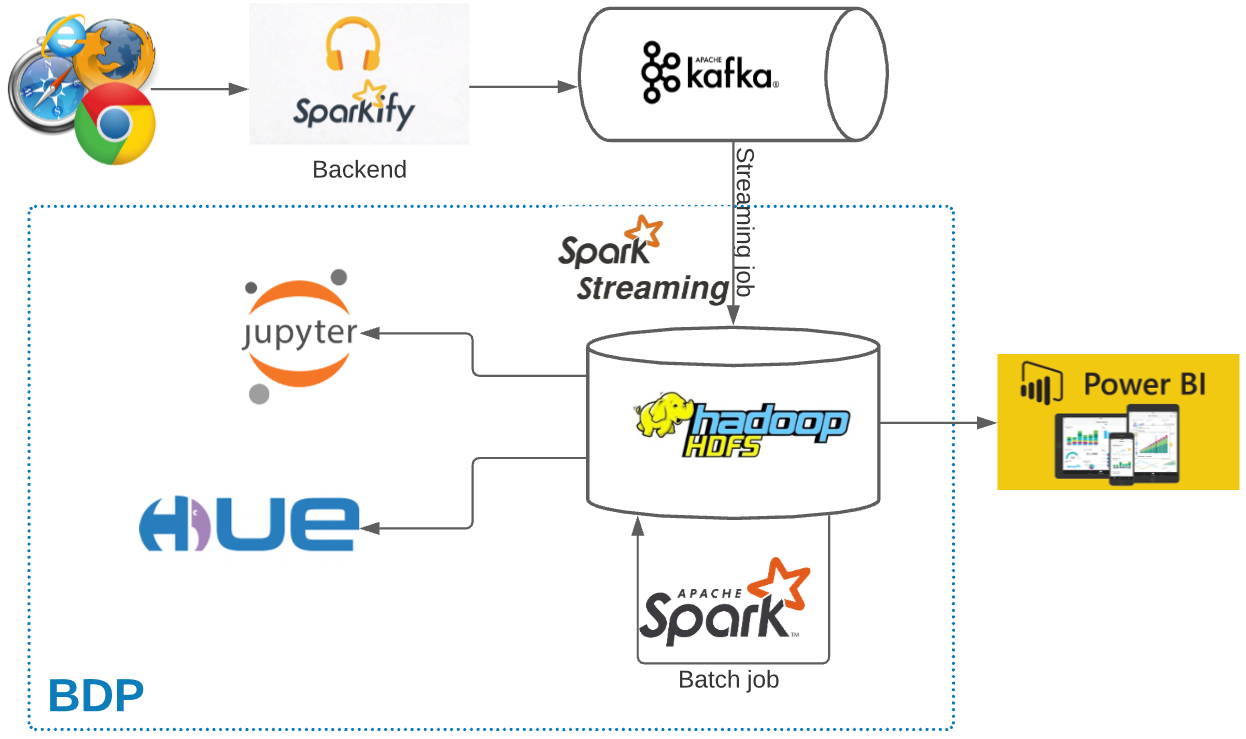
Spakify is a music streaming sevice as similar to Spotify. Every users’ activities on Sparkify application are logged and sent to Kafka cluster. To improve the business, the data team will collect data to a Big Data Platform for further processing, analysing and extracting insights info for respective actions. One of the focusing topic is churn user prediction.
Business understanding
We assume that user of Sparkify can be either Premium or Free Tier subscription, The premium plan with subscription fee and enjoy more songs without advertisements.
As an end user, he/she can do:
- Upgrade from free tier to Premium subscription
- Downgrade from Premium to free tier
- Drop their account and leave the service
The goals are:
- analyse data
- extract insights to identify churn indicators
- build machine learning model to help predict potential churn ones
The notebook including analysis, feature engineering and model building can be found in the jupyter folder from below repository:
Dataset
This is a public dataset named
Million Song Datasetand can be download under json format prepared byUdacityfrom hereContains 18 columns which has the information of customers(gender, name, etc.) and API events(login, playing next song, etc.)
Experiment period: 2018–10–01 to 2018–12–01
Kafka message example:
1
2
3
4
5
6
7
8
9
10
11
12
13
14
15
16
17
18
19
20
{
"ts":1543621857000,
"userId":"300011",
"sessionId":500,
"page":"NextSong",
"auth":"Logged In",
"method":"PUT",
"status":200,
"level":"paid",
"itemInSession":37,
"location":"New York-Newark-Jersey City, NY-NJ-PA",
"userAgent":"Mozilla/5.0 (compatible; MSIE 9.0; Windows NT 6.1; WOW64; Trident/5.0)",
"lastName":"House",
"firstName":"Emilia",
"registration":1538336771000,
"gender":"F",
"artist":"Olive",
"song":"You\\'re Not Alone",
"length":264.12363
}Data is ingested into Hive database, so Spark can easily query as normal database. What we are doing is in Jupyter paart the below data pipeline diagram.
Data cleaning and exploration
Data cleaning
There are 543,703 records with 15,700 empty userid values found. To prevent the similar issue on new incoming data if any, the filter will be apply before further step.
1 | df = spark.sql(f"select * from {target_table} where userid is not null and sessionid is not null and userid <>''") |
Data exploration
Churn indicator: users who visited the service and submit
Cancellation Confirmationare treated as churned.Churn user can be happening at both level of
freeorpaid, however we see it likely more on free. User might not prefer the less features, more ads on free service but not intend for a paid account.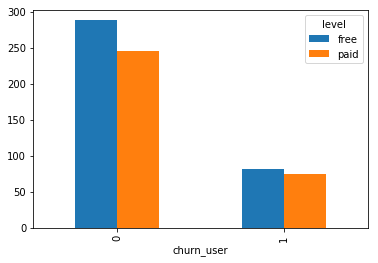
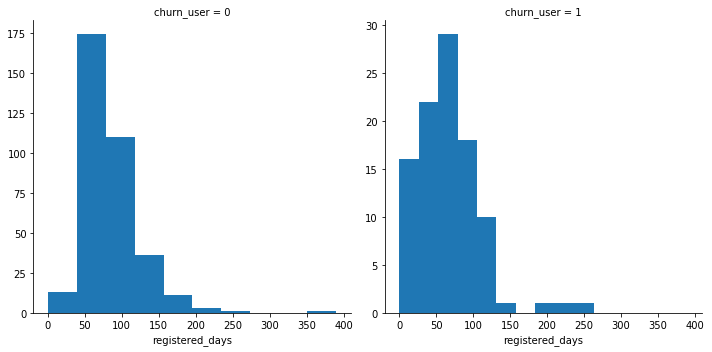
As denoted on below histogram, loyal users with more registered days are less churned.
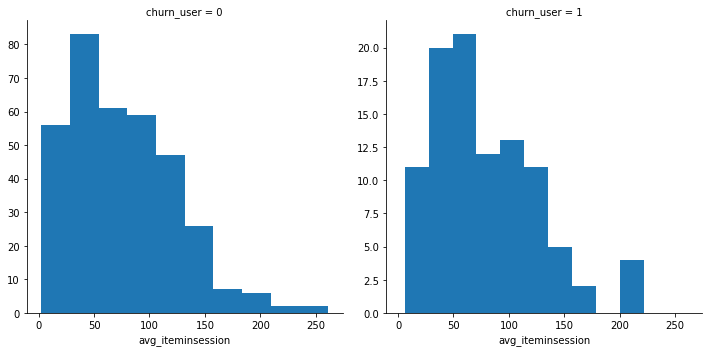
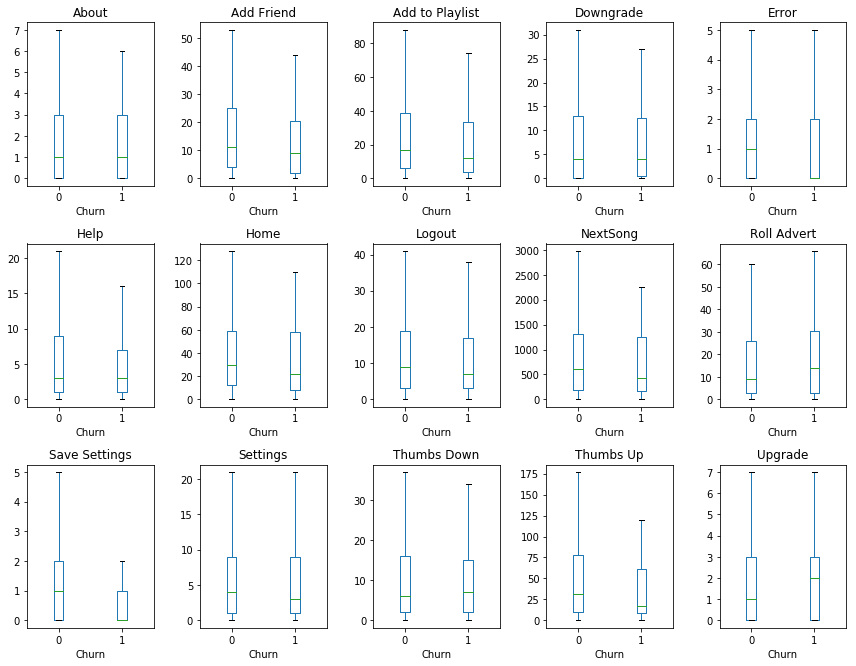
Look at average item item in a session, we see that churn users are less interactive with less item count per session.
There are 2 interesting findings: churn users have less Thumbs up, more Thumps down and Roll Advert in the Page Event extraction. Next steps are to feed these features into machine learning algorithm to identify which contributes most to the churning rate.
Feature engineering
In this step, we will target to perform the engineering for number of available features in provided dataset, and observed during data exploration step.
- Define churn indicator derived from its return reponse of
Cacellation Confirmation - Last level of
paidorfree - Registered days which is the duration between the registration and last event user logged to the music service
- The gender is kept to see how much it impacts to the final model
- Average length of song duration
- Average session duration user spent
- Average daily count for number of page event
Model training and evaluation
The purpose of this step is to build a machine learning model that can predict which customers are likely to churn and which not. So the model is consider to use to solve a binary classification problem. The classes are churned and not churned.
Model evaluation metrics
Because the churned users are a fairly small subset compared to non-churn ones, the f1-score is selected for model evaluation metric.
This metric will help to balance the prevision and recall metrics.
Trained models and evaluation
We did evaluate the models on there common algorithms including Logistic Regression (lr), Random Forest (rf) and Gradient-Boosted Trees (gbt). The models are then compared to in term of f1 score.
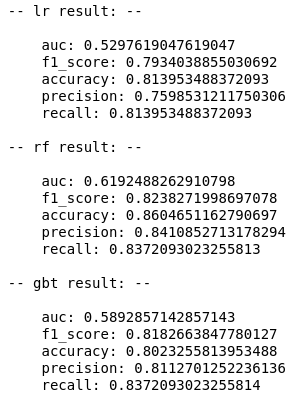
Based on the result, Random Forest is selected as its result is better compared to others (f1-score=0.82). By perform further parameters tuning with numTreses=75, maxDepth=20, Random Forest can achieve better result of 0.87.
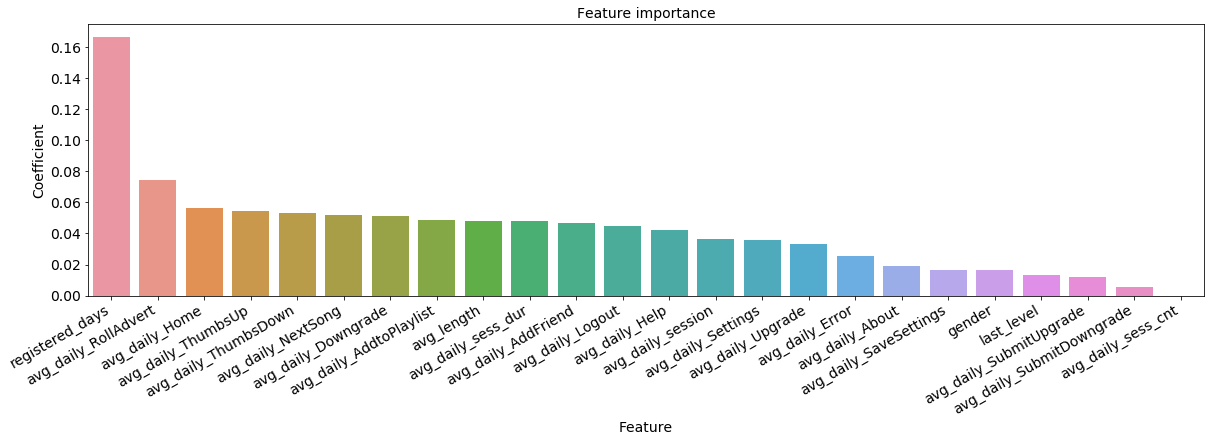
As described in the feature importance chart, top features contributing to churn rate are registered_days, rolling advert, etc. which are valuable information for product team to improve the service for better customer retention.
Conclusion and potential improvement
In this project, we have implemented a model to predict customer churn for Sparkify streaming music service. The whole project was taken place on Apache Spark data processing engine.
The complete workflow is comprised of cleaning, exploring, featuring, modeling, evaluating result steps to select the best suitable model for the churn user prediction problem.
With future improvement, we can try more other machine learning algorithms, and extract more features from location and useragent columns which potential containing some impact insights. Furthermore, applying hyperparameter tuning on Spark to utilize the engine power for better optimal parameters.
Comments