Apart from core APIs which requires external systems to install Kafka client for the integration, Kafka also supports Kafka Connect API with REST API for the more flexibility in communicating with different systems. This note is to collect list of basic APIs on frequent useage.
Kafka CLI

Once working with Kafka, I often need to quickly interact with Kafka cluster via command line. This post is my collection of frequent commands used in daily work with projects having Kafka integrated.
Spark fundamental

Spark is an unified engine designed for large scale distributed data processing and machine learning on compute clusters, whether running on-premise or cloud. It replaces Hadoop MapReduce with its in-memory storage for intermediate computations, making it much faster (100x) than Hadoop MapReduce.
Kerberos on Hadoop

The Kerberos is an authentication protocol which creates tickets to allow communication between nodes on non-secured network. Ticket must be periodically triggered by kinit command by each user. In Kerberos we call users as principals. We can divided principals basically into several groups:
- System users – principals for communication between services in Hadoop cluster
- Common users
Yarn walkthrough

YARN stands for Yet Another Resource Negotiator. It was introduced in Hadoop version 2 to extend other data processing framework to not only Map Reduce such as Spark, Storm, etc.
Kafka fundamental

Apache Kafka is a distributed streaming platform. It is used for building real-time data pipelines and streaming apps. It is horizontally scalable, fault tolerant, wicked fast, and runs in production in thousands of companies.
Code-server, the VSCode for cloud
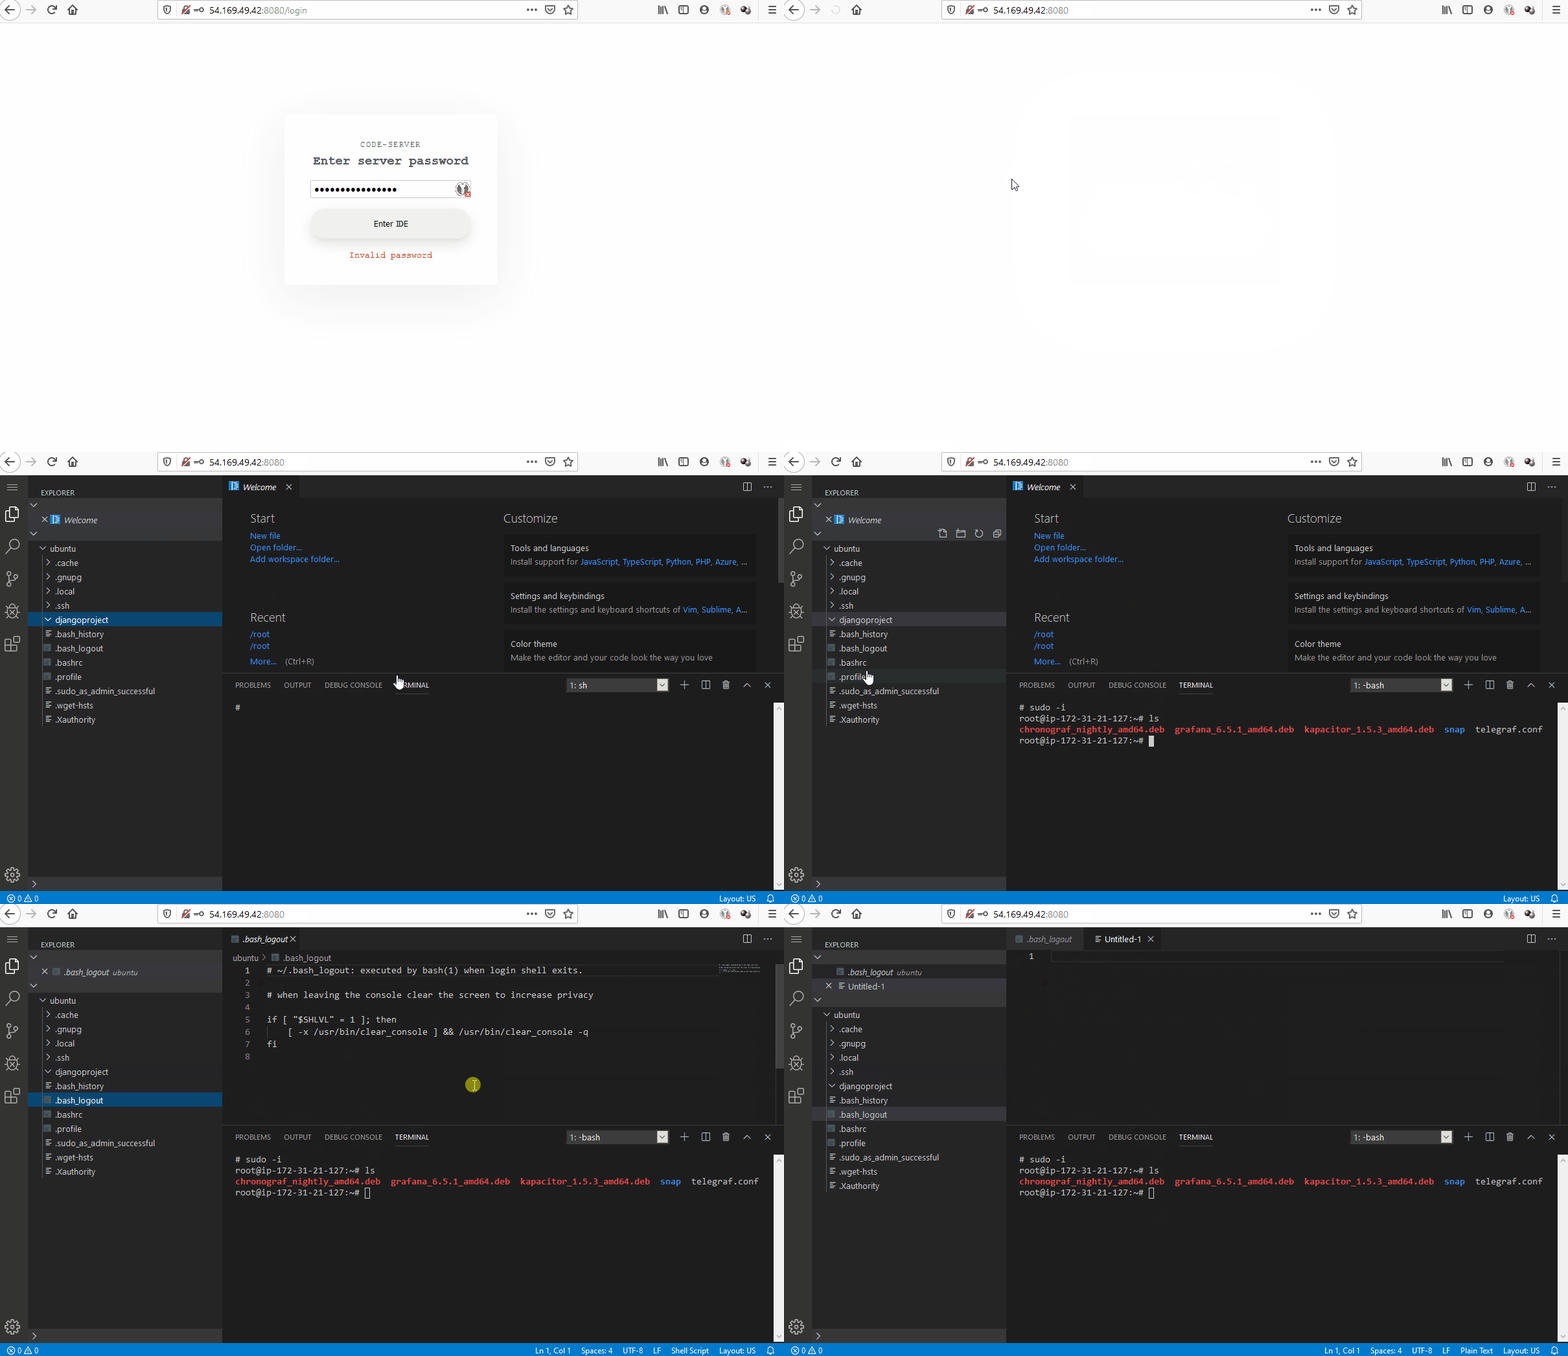
Along with the widely cloud adoption, integrated development environment (IDE) on browser is a need to boot developers’ productivity. People can collaboratively view, edit and commit on any devices with internet accessed browser. Additionally, you’re no longer worry about setting up your local development config. You can consider Cloud9 (AWS) or paid service like codeanywhere.
Kibana, the elastic stack's central management
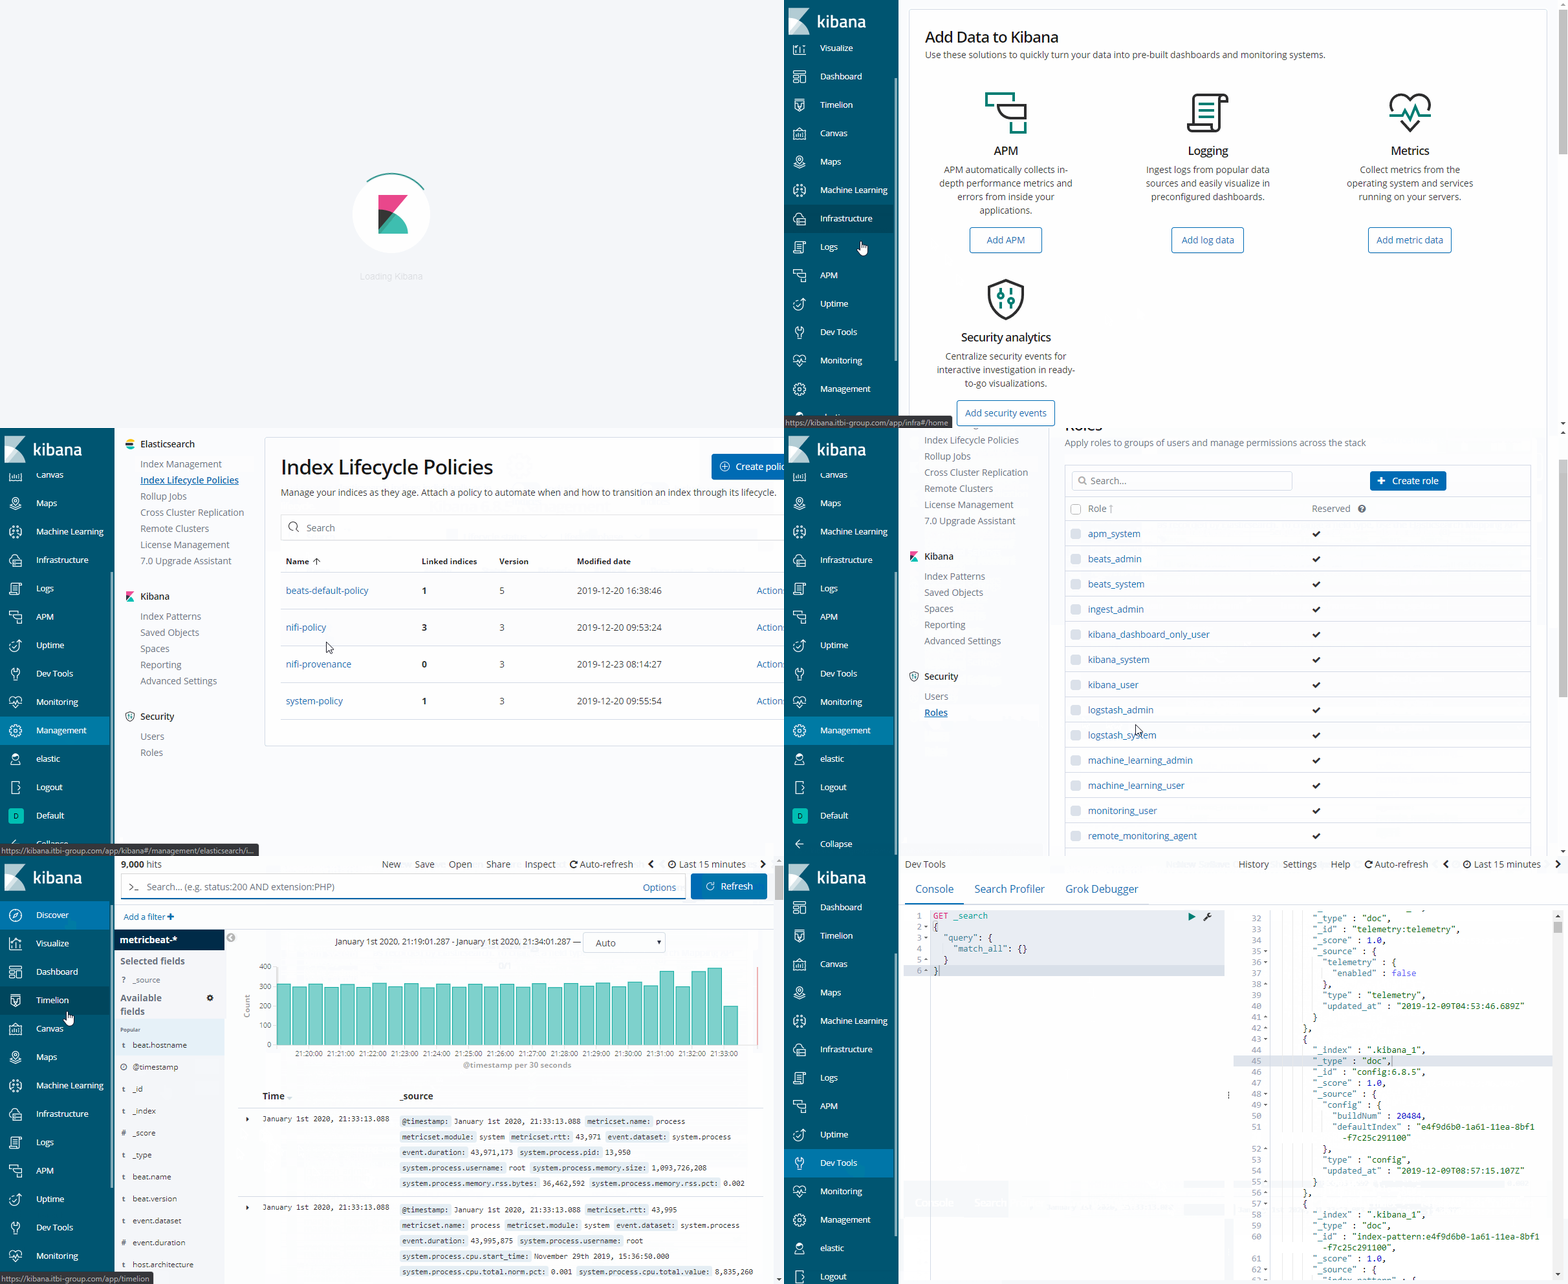
Kibana is part of ELK stack to visualize data from elasticsearch. Further than that, Kibana is equipped with many features and plug-ins such as elastic nodes & infrastructure monitoring, user roles or life cycle management and query experiment elasticsearch database.
Spend sometime with the demo Kibana page to feel it. Click Here.
Grafana, the best visualization tool for monitoring?
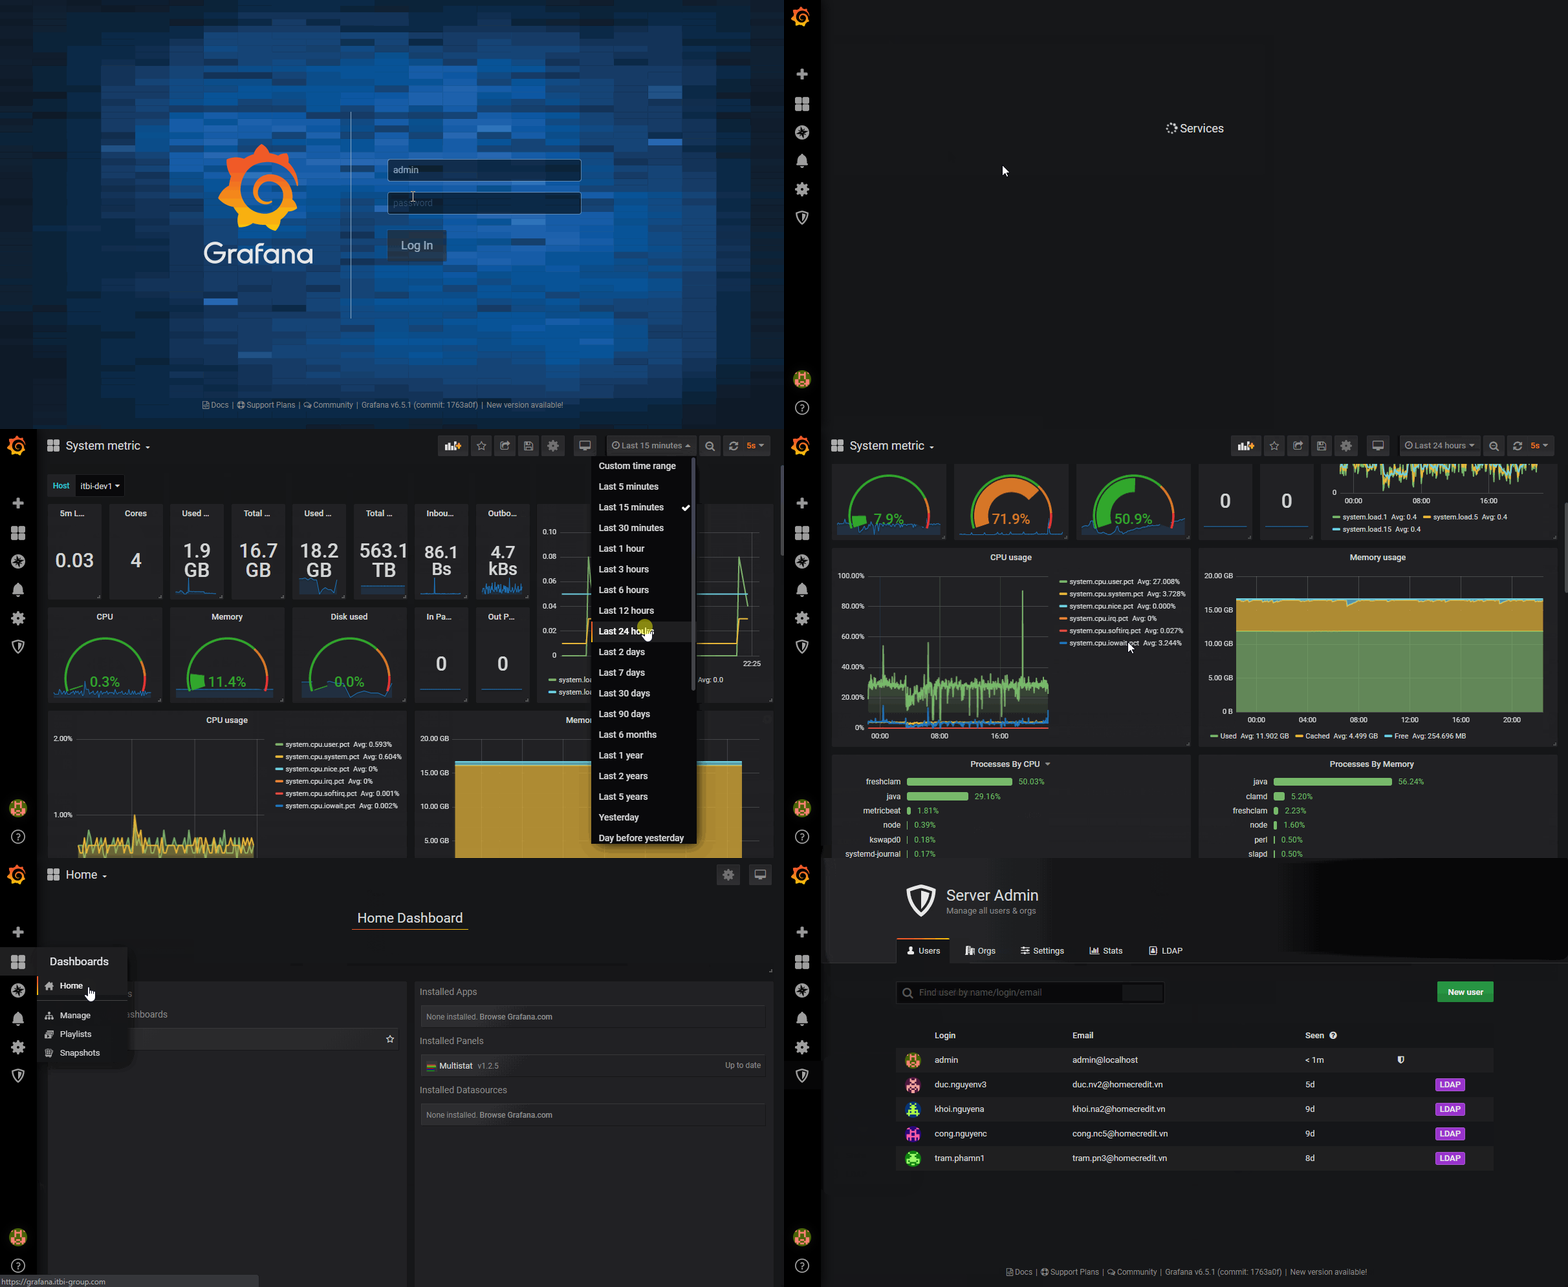
Grafana is an open-source web application specialized in time-series visualization. Hence, it is suitable for the the purpose of monitoring. One of interesting facts is that Grafana is a fork from Kibana 3 to enhance the ability of dashboard editing and make it as a clean and elegant time-series visualization tool. To get the sense of Grafana dashboard, surf this link: https://play.grafana.org.
Quick tour with Elasticsearch 6.x
When do researching to choose a good data storage technique for log collection, searching and analytic; I found elasticsearch is a ideal choice because of following reasons:
- Performance: fast query with million records within miliseconds, it is thanks to indexing document technique with Lucene engine running under-the-hood.
- Scalability: elasticsearch can be expanded by simply configuring new nodes when resource increase needed.
- Integration : it is compatible with elastic stacks (beats: metric, file, heart, etc. ) and others (Fluentd, grafana, etc.) which support many purposes to monitor multiple system and services.